12. Gallery
A collection of example CIS plots along with the commands used to generate them.
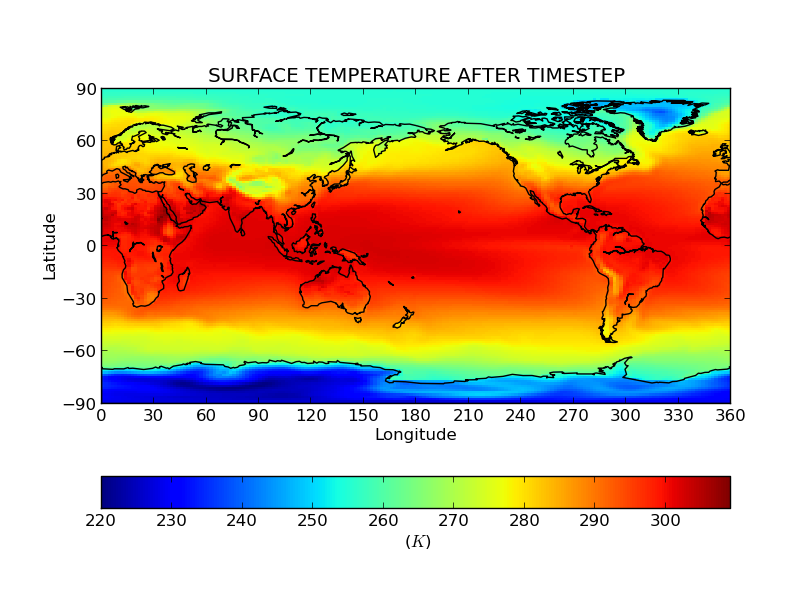
Model output data
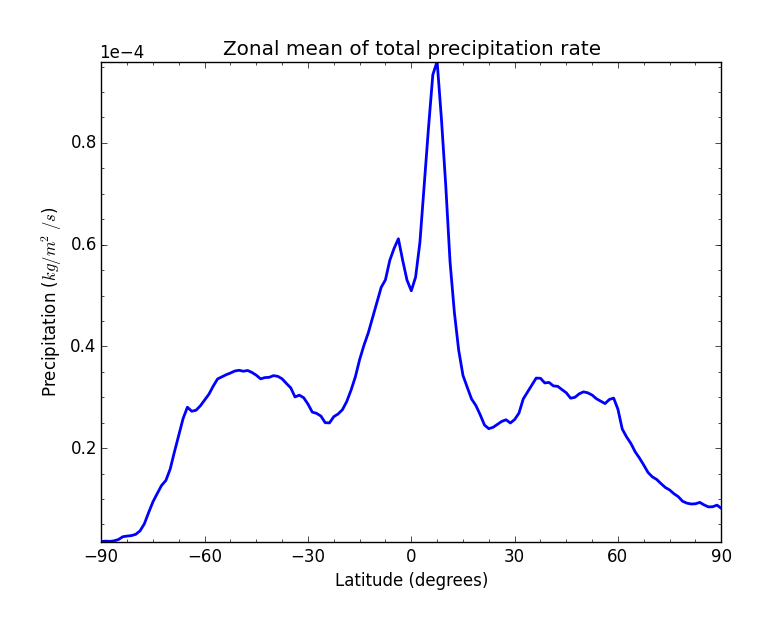
Aggregated model data
% cis plot precip:xenida_zonal.nc –itemwidth=2 –xaxis latitude –xlabel “Latitude (degrees)” –yaxis precip –ylabel “Precipitation ($kg/m^2/s$)” –title “Zonal mean of total precipitation rate” -o line.png
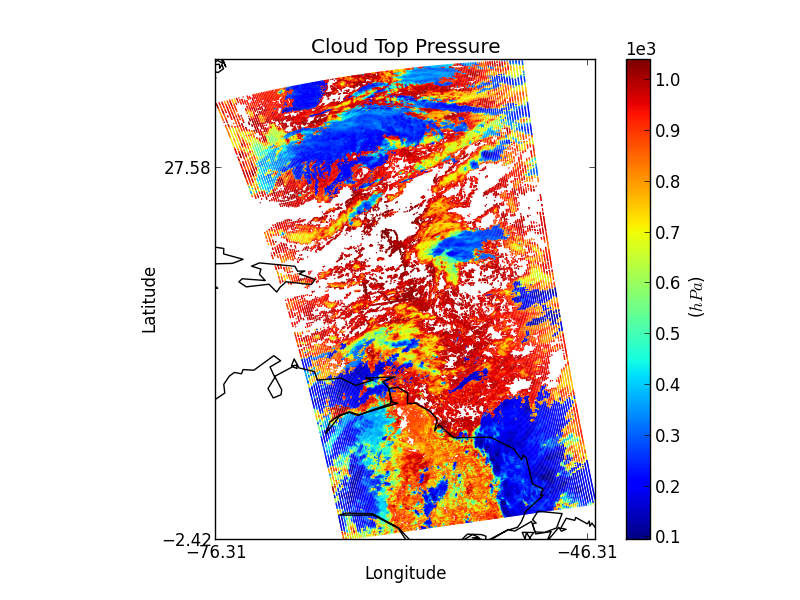
MODIS Level 2
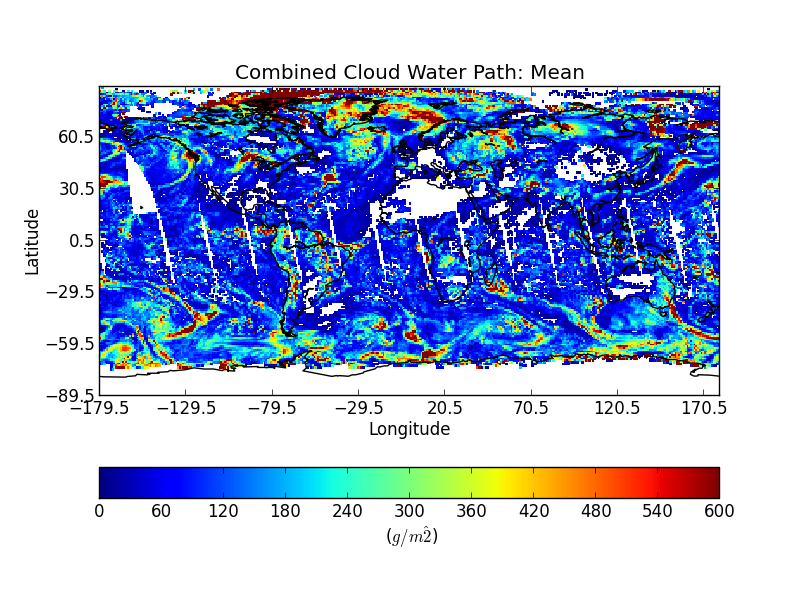
MODIS Level 3
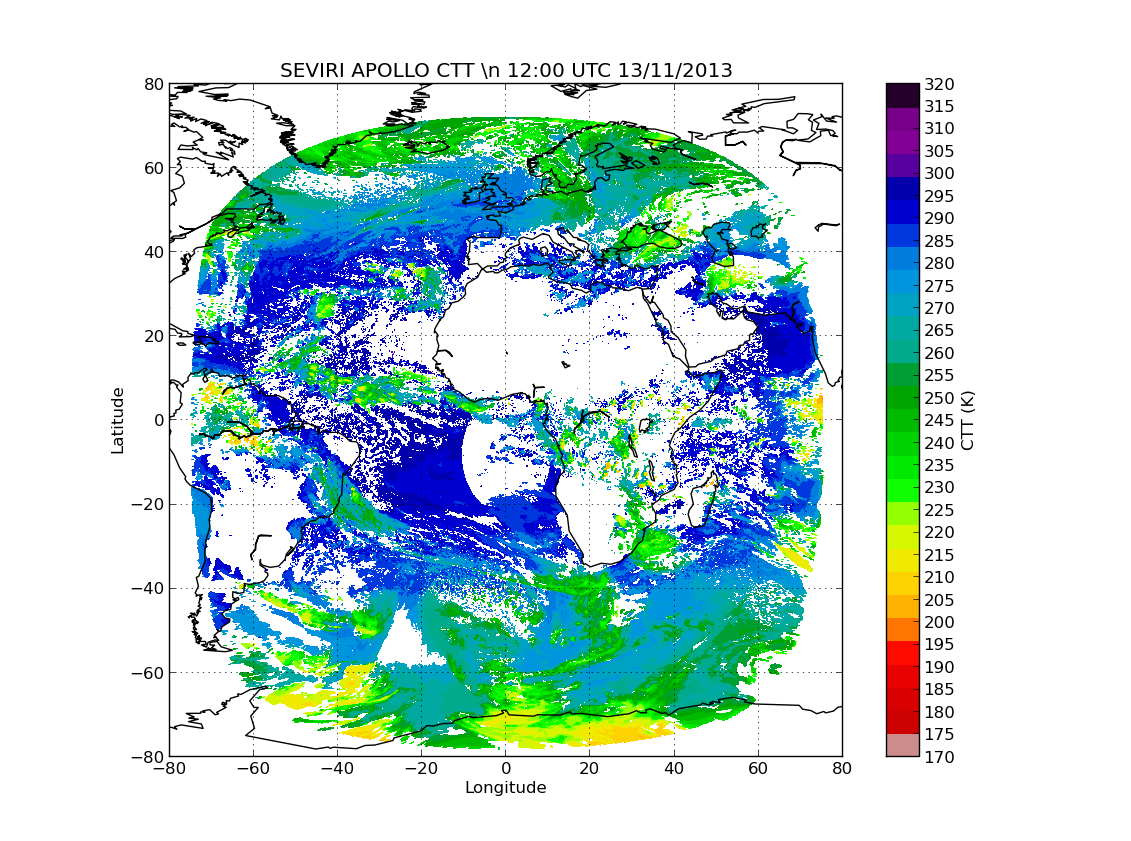
Seviri Cloud top temperature
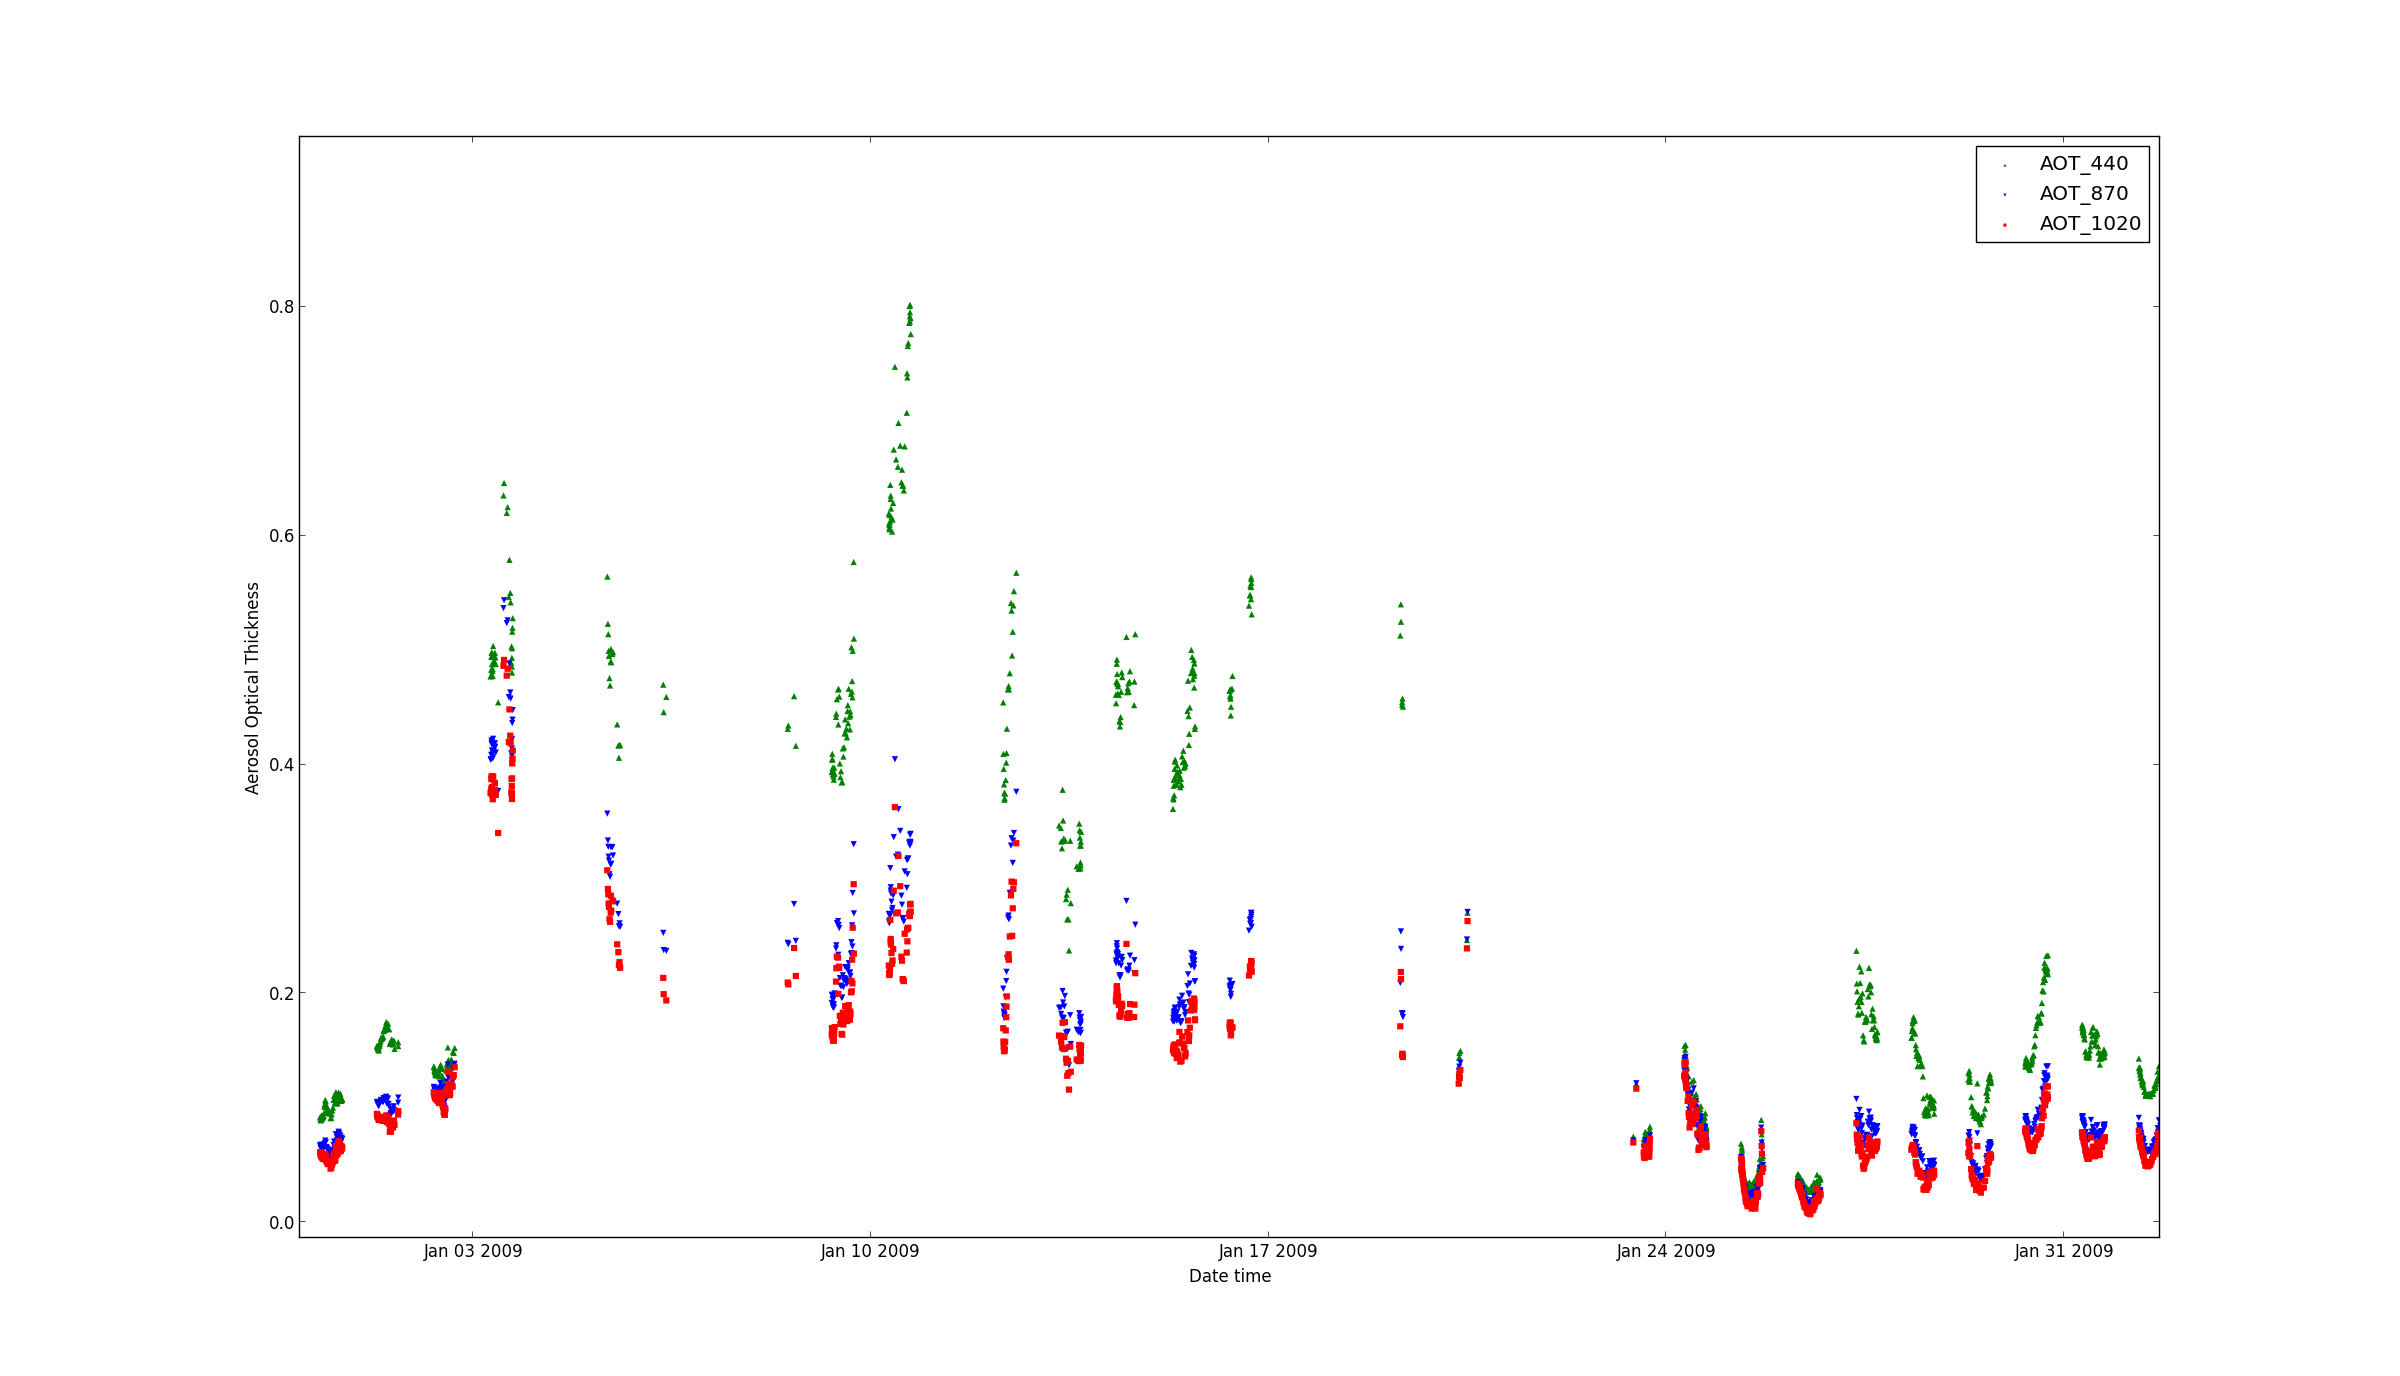
Aeronet time series
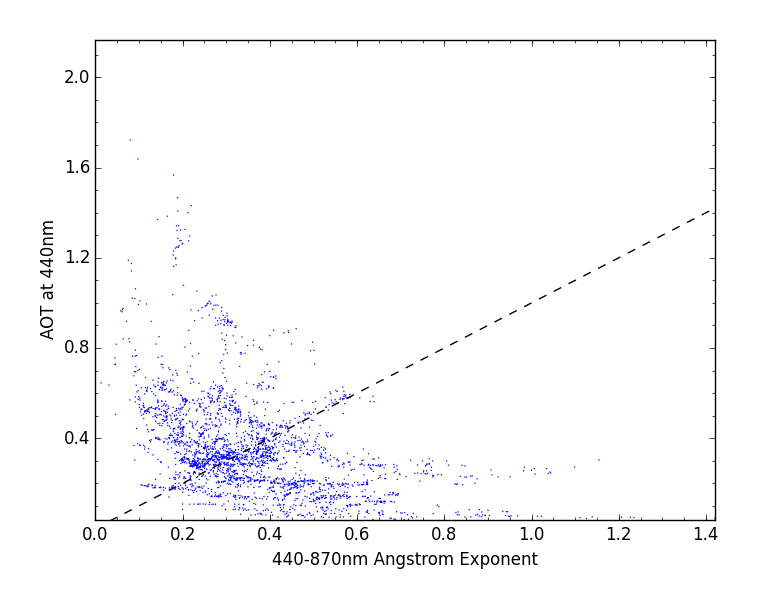
Aeronet comparative scatter
% cis plot 440-870Angstrom:../cis_repo_test_files/920801_091128_Agoufou_small.lev20 AOT_440:../cis_repo_test_files/920801_091128_Agoufou_small.lev20 –xlabel “440-870nm Angstrom Exponent” –ylabel “AOT at 440nm” –title “” –type comparativescatter -o comparative_scatter_Aeronet.png
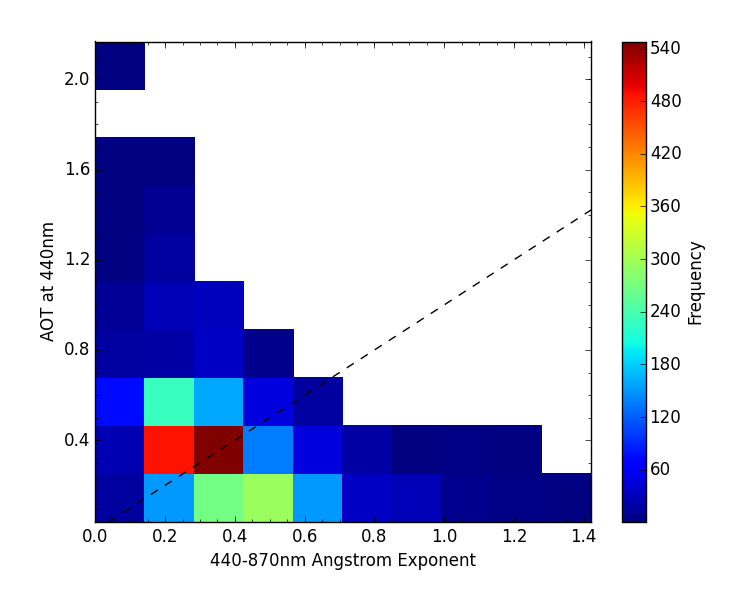
Aeronet comparatice histogram
% cis plot 440-870Angstrom:920801_091128_Agoufou_small.lev20 AOT_440:../cis_repo_test_files/920801_091128_Agoufou_small.lev20 –xlabel “440-870nm Angstrom Exponent” –ylabel “AOT at 440nm” –title “” –type histogram3d -o comparativehistogram3d
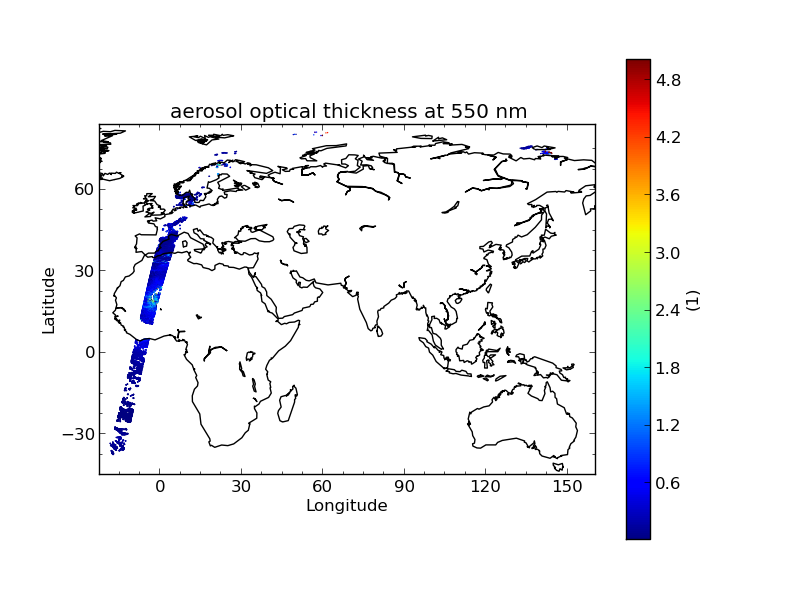
Aerosol CCI
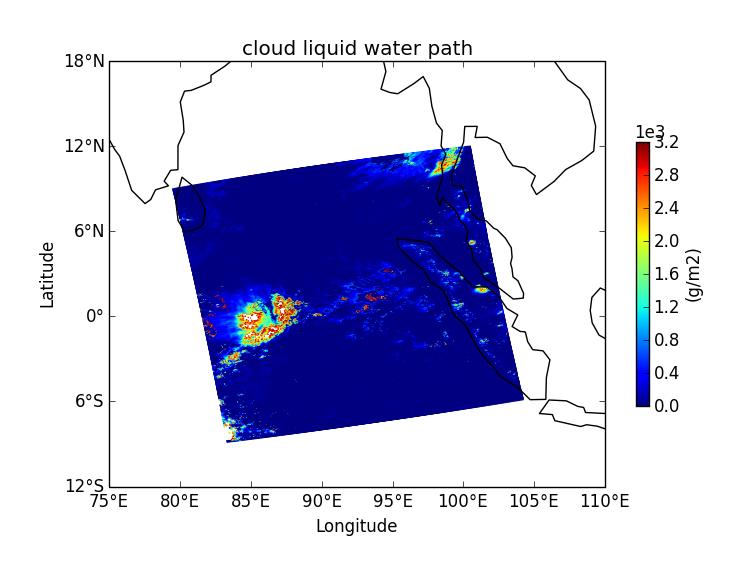
Cloud CCI
%cis plot cwp:20080620072500-ESACCI-L2_CLOUD-CLD_PRODUCTS-MODIS-AQUA-fv1.0.nc
-o Cloud_CCI –xmin 75 –xmax 110 –xstep 5
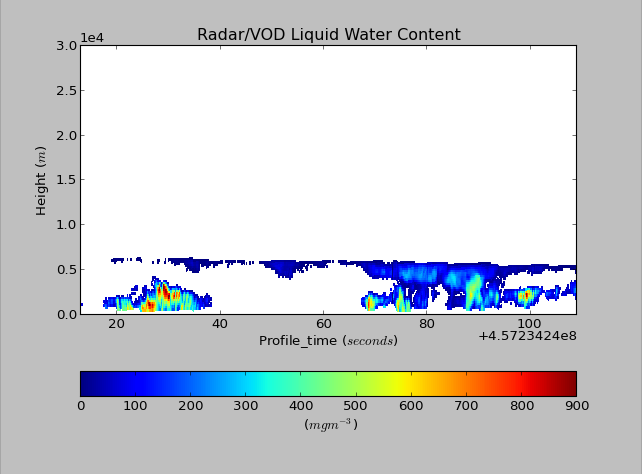
CloudSat Liquid water content
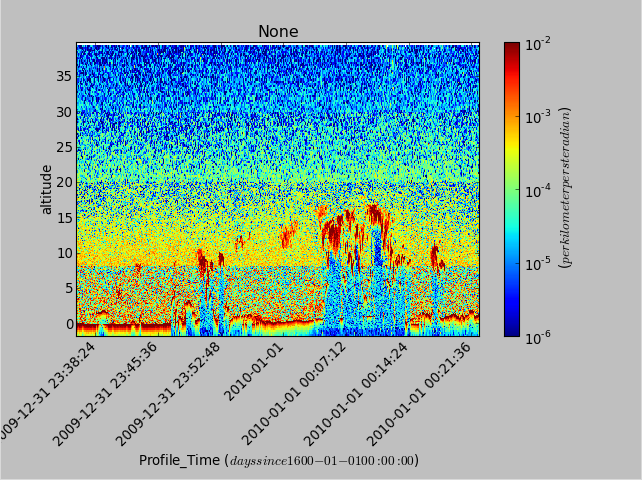
CALIOP Level 1b
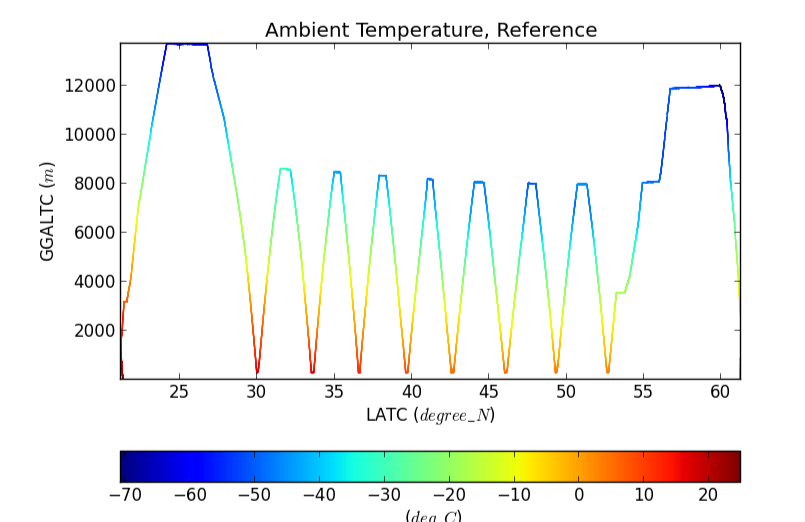
NCAR-RAF ambient temperature
% cis plot ATX:RF04.20090114.192600_035100.PNI.nc –xaxis latitude –xlabel
“Latitude (degrees north)” –yaxis altitude –ylabel “Altitude ($m$)” –cbarlabel “$^{circ}C$” -o aircraft.png